Emissions from Transport Sector
There is a significant impact of the transport sector on greenhouse gas emissions. Here’s a breakdown:
1. Transport sector contributes to – 1/4th of the greenhouse gas emissions
- The transport sector is responsible for approximately 25% of all greenhouse gas emissions, making it a major contributor to climate change.
2. 95% transport energy – sourced from fossil fuel
- The vast majority (95%) of the energy used for transportation comes from fossil fuels like gasoline, diesel, and jet fuel. This reliance on fossil fuels is a key driver of greenhouse gas emissions.
3. The e-vehicle debate – hybrid vehicles
- This statement introduces the ongoing discussion about electric vehicles (EVs) and their potential to reduce emissions. Hybrid vehicles, which combine electric and gasoline power, are mentioned as one type of alternative to traditional fossil fuel-powered vehicles.
4. 45% of countries transport is largest source of energy related emissions
- In 45% of countries, the transport sector is the primary source of energy-related emissions, emphasizing its dominant role in contributing to greenhouse gas emissions in many regions.
5. Contributes to 57% of global oil demand
- The transport sector is responsible for a significant portion of global oil consumption, accounting for 57% of the total demand. This high demand for oil further contributes to greenhouse gas emissions.
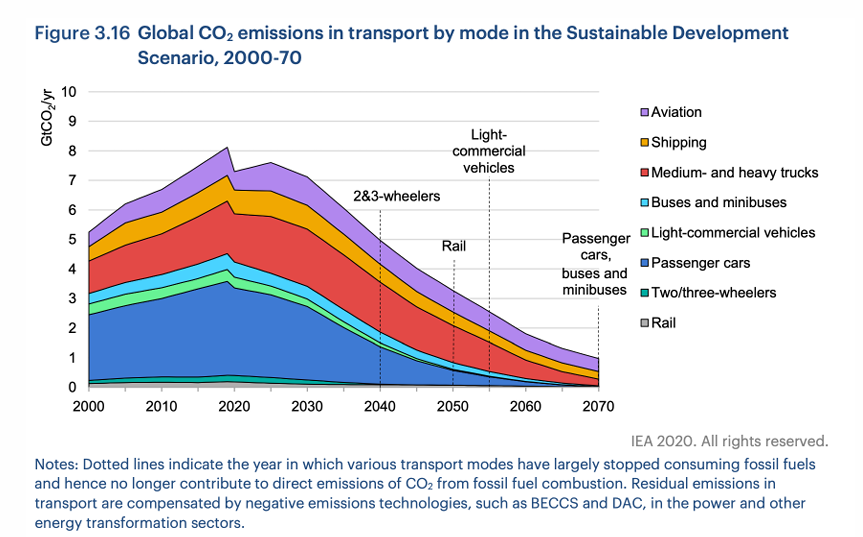
6. Shipping & Aviation > 20%
- The shipping and aviation industries together account for more than 20% of global greenhouse gas emissions from the transport sector. These modes of transportation are particularly challenging to decarbonize due to their scale and long-distance operations.
7. Tourism sector – 22%
- The tourism sector is responsible for 22% of global greenhouse gas emissions from the transport sector. This is primarily due to the transportation associated with travel and tourism activities, such as airplanes, trains, and cars.
8. Up to 30% share in GHG emission
- In some regions or countries, the transport sector’s share in greenhouse gas emissions can be as high as 30%. This indicates that the impact of transportation on climate change varies depending on the specific location and its reliance on different modes of transport.
Overall, this text highlights the critical role of the transport sector in contributing to greenhouse gas emissions and the urgent need for transitioning to cleaner and more sustainable forms of transportation.


Emissions from Transport Sector – India
This section provides a specific focus on the transport sector’s contribution to greenhouse gas emissions in India:
1. Transport sector – third most greenhouse gas (GHG) emitting sector
- In India, the transport sector is the third-largest source of greenhouse gas emissions, following energy and industry.
2. Accounted for 14 per cent of our energy-related CO2 emissions (2021)
- In 2021, the transport sector was responsible for 14% of India’s energy-related carbon dioxide (CO2) emissions.
3. 3x increase from 1990 – 2021
- The emissions from the transport sector in India have increased significantly, with a threefold rise from 1990 to 2021. This indicates a rapid growth in transportation activities and the associated emissions.
4. Vehicles plying on the road expected to almost double to over 200 million by 2030
- The number of vehicles on Indian roads is projected to nearly double by 2030, reaching over 200 million. This substantial increase in vehicles will likely lead to a further rise in emissions unless measures are taken to mitigate them.
5. Majority of Indian cities – NMT share is >1/4th of passenger trips
- In most Indian cities, non-motorized transport (NMT) modes like walking and cycling account for more than a quarter of passenger trips. This highlights the importance of NMT in urban transportation and its potential to reduce emissions.
6. Road transport currently accounts for 20-30% of urban air pollution
- Road transport is a major contributor to air pollution in Indian cities, contributing between 20% and 30% of the total pollution. This poses significant health risks to urban populations.
Overall, this text emphasizes the growing environmental impact of the transport sector in India and the need for sustainable and low-carbon transportation solutions to address the challenges of emissions and air pollution.

Exhaust vs. Non-Exhaust Emissions
This part discusses the different types of emissions from vehicles:
Exhaust Emissions
- Tail pipe emissions: These are the gases and particulate matter that come directly out of the vehicle’s exhaust pipe. They are regulated by emission standards.
- Bharat Stage (BS) emission standards: India has implemented BS emission standards to control tail pipe emissions.
- Parallel to Euro-6/VI norms: The BS standards are equivalent to the Euro-6/VI norms used in Europe, indicating a commitment to reducing emissions.
- NOx emissions from road transport decline by 15-20% by 2030: It is expected that emissions of nitrogen oxides (NOx) from road transport will decrease by 15-20% by 2030 due to stricter emission standards and advancements in vehicle technology.

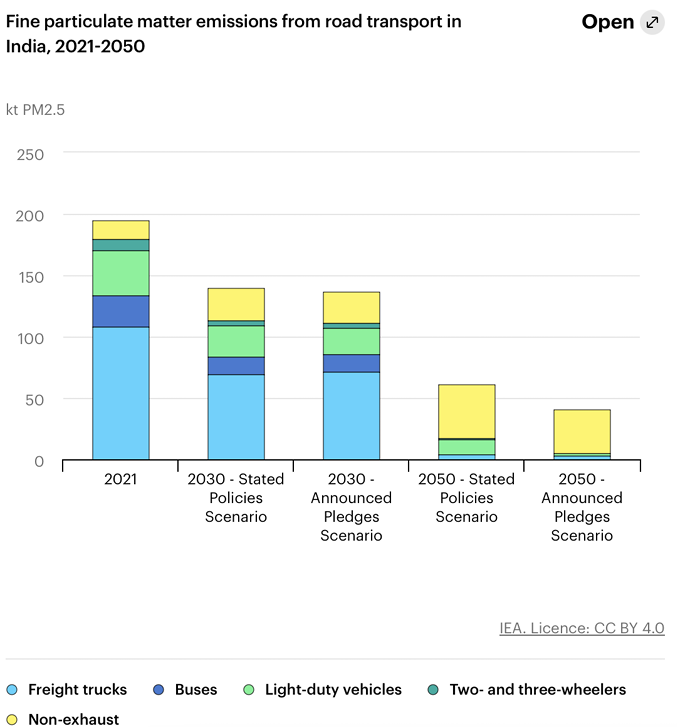
Non-Exhaust Emissions
- Non-exhaust PM2.5 emissions: These are fine particulate matter (PM2.5) that are not directly emitted from the tailpipe but are generated through other processes related to vehicle use.
- Caused by the suspension of road dust, brakes and tyre wear abrasion: Non-exhaust PM2.5 emissions primarily arise from the suspension of road dust, the abrasion of brakes and tires, and other sources associated with vehicle movement.
Overall, this text highlights that while significant progress has been made in reducing tail pipe emissions through standards like BS, addressing non-exhaust emissions remains a challenge. Managing road dust, improving brake and tire technology, and exploring alternative road surfaces are essential to further reduce the environmental impact of the transport sector.
Health Impact of Transport Sector
This section outlines the various health impacts associated with the transport sector. It emphasizes that these impacts can be direct, indirect, and cumulative, affecting entire communities.
Direct Impacts:
- Communicable diseases: Exposure to pollutants from vehicles can contribute to the spread of communicable diseases.
- Accidents: Transportation accidents, such as car crashes, can lead to injuries and fatalities.
- Exposure to hazardous conditions: Exposure to noise pollution, air pollution, and other hazardous conditions associated with transportation can have negative health effects.
Indirect Impacts:
- Cumulative change in community exposures: The long-term accumulation of exposure to health risks from transportation can have significant consequences for communities.
Positive and Negative Impacts:
- Can be positive – negative, intended – unintended, single or cumulative: Health impacts can be both positive and negative, intended and unintended, and can occur as single events or accumulate over time.
- Range of changes may be unevenly distributed: The effects of transportation on health may not be evenly distributed, with certain populations or communities experiencing greater impacts than others.
Equity and Vulnerability:
- Consider the equity of impact: It is important to consider the equity of health impacts, ensuring that vulnerable populations are not disproportionately affected.
- Vulnerability – social, environmental and institutional determinants of health: Vulnerability to health risks is influenced by social, environmental, and institutional factors, such as socioeconomic status, access to healthcare, and exposure to environmental hazards.
- Certain subgroups may be disproportionately affected: Some subgroups, such as children, the elderly, and those with underlying health conditions, may be more susceptible to the negative health effects of transportation.
Overall, this text highlights the complex and multifaceted health impacts of the transport sector. Addressing these impacts requires a comprehensive approach that considers both direct and indirect effects, equity, and the vulnerability of different populations.

Short-Term Impact and Integrated Transport and Health Impact Modeling
This text discusses the importance of integrated transport and health impact modeling and its potential applications.
Integrated transport and health impact modeling tool
- Perform integrated assessment of the health effects of transport scenarios at the urban and national level: This tool can evaluate the health impacts of various transportation scenarios, considering both urban and national scales.
- Modelled through the changes in physical activity, road traffic injury risk, and exposure to fine particulate matter (PM2.5) air pollution: The model assesses health effects by analyzing changes in physical activity levels, the risk of road traffic injuries, and exposure to PM2.5 air pollution.
- Predict changes in CO2 emissions: The tool can also predict the changes in carbon dioxide (CO2) emissions associated with different transportation scenarios.
Source: https://www.mrc-epid.cam.ac.uk/research/research-areas/public-health-modelling/ithim/
Key Users:
- Health and transport professionals: This tool is valuable for both health professionals and transport planners as it provides insights into the health implications of transportation decisions.
Applications:
- Compare the impact of travel patterns in different places: The tool can be used to compare the health impacts of different travel patterns in various locations.
- Model the impact of interventions: It can also model the potential health benefits of implementing various transportation interventions, such as improving infrastructure for walking and cycling, promoting public transport, or introducing electric vehicles.
Integration with Other Models:
- Can be linked with transport, health, economic models: The integrated transport and health impact modeling tool can be linked with other models related to transportation, health, and economics, providing a more comprehensive understanding of the interrelationships between these sectors.
Overall, this text highlights the significance of integrated transport and health impact modeling in assessing the short-term and long-term health consequences of transportation decisions. By providing valuable insights and supporting informed decision-making, this tool can contribute to improving public health and reducing the environmental impact of transportation.

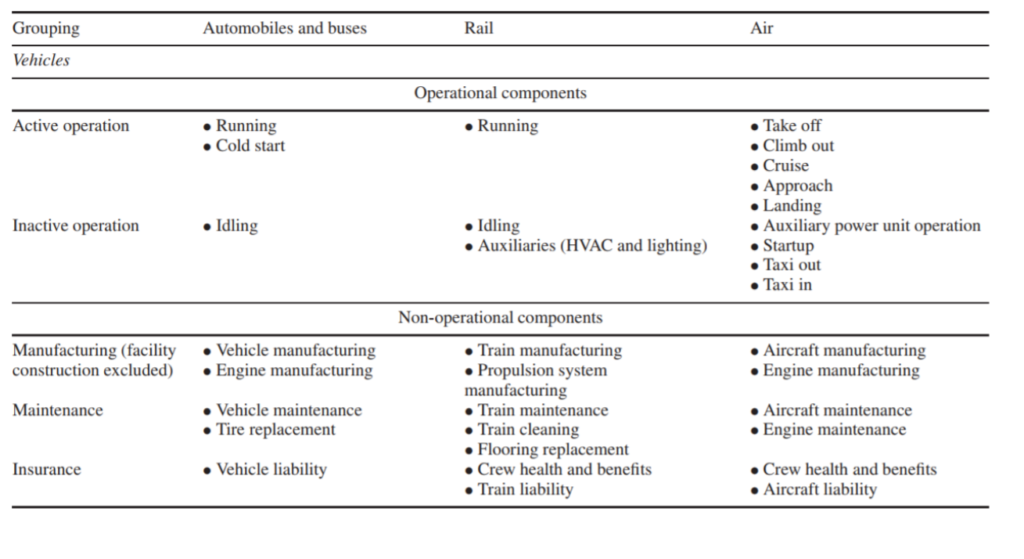
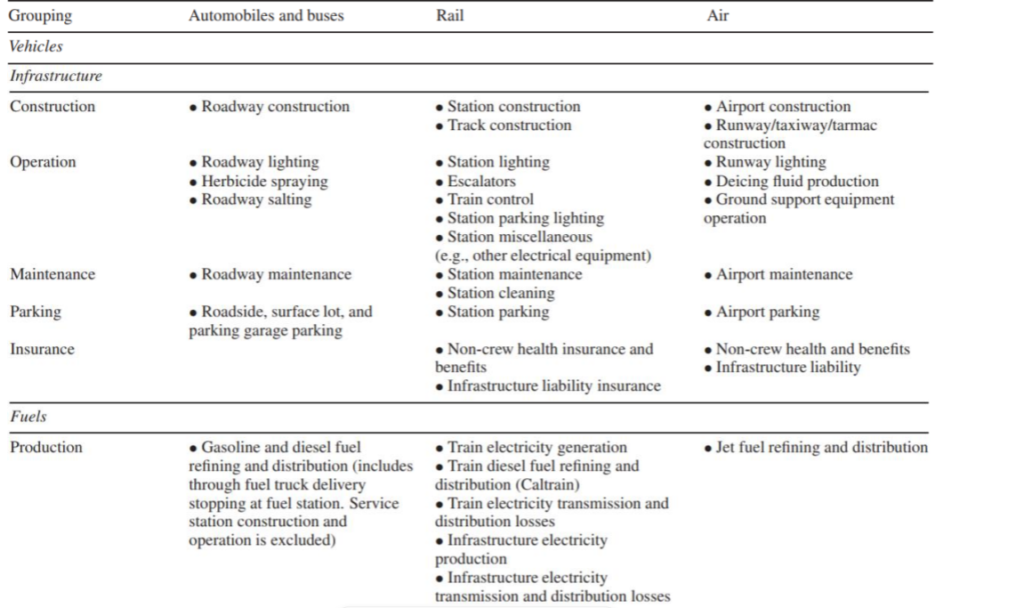
Long-Term Impact: Life Cycle Assessment (LCA)
Life Cycle Assessment (LCA) is a comprehensive methodology used to evaluate the environmental impacts of a product, process, or service throughout its entire life cycle. It provides a holistic view of the environmental implications, from raw material extraction to disposal.
LCA Types:
- Cradle to Grave: Considers the entire life cycle, from raw material extraction to final disposal.
- Cradle to Gate: Evaluates the life cycle from raw material extraction to the factory gate, excluding transportation and use phases.
- Cradle to Cradle: Aims to design products that can be recycled or reused indefinitely, minimizing waste.
Four Phases of LCA:
- Goal and Scope Definition:
- Clearly define the purpose of the LCA.
- Determine the product system to be analyzed, including its functions.
- Establish the functional unit (the unit of measurement for comparing different systems).
- Define the system boundary, specifying the processes included and excluded.
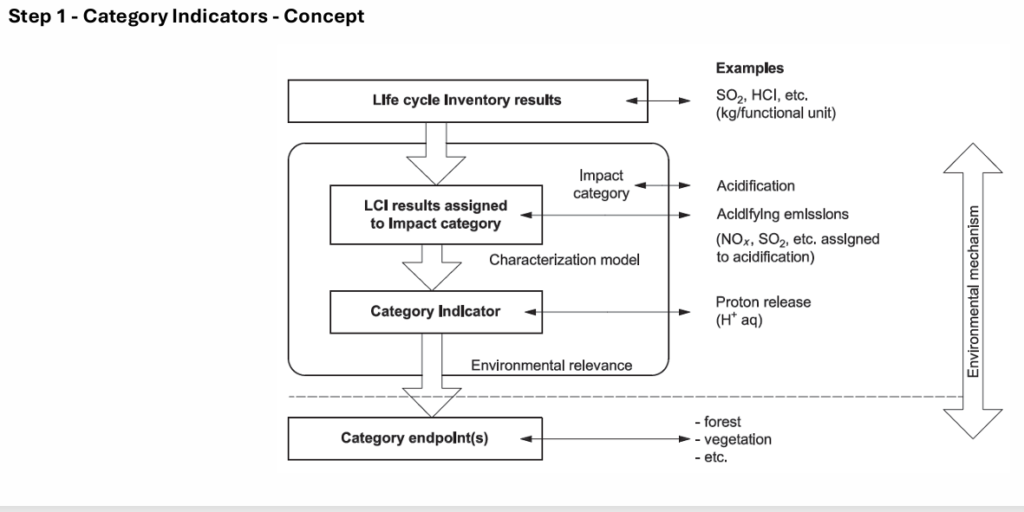
- Life Cycle Inventory Analysis:
- Collect data on the inputs (resources) and outputs (emissions) associated with each process in the life cycle.
- Consider factors like energy consumption, water use, waste generation, and greenhouse gas emissions.
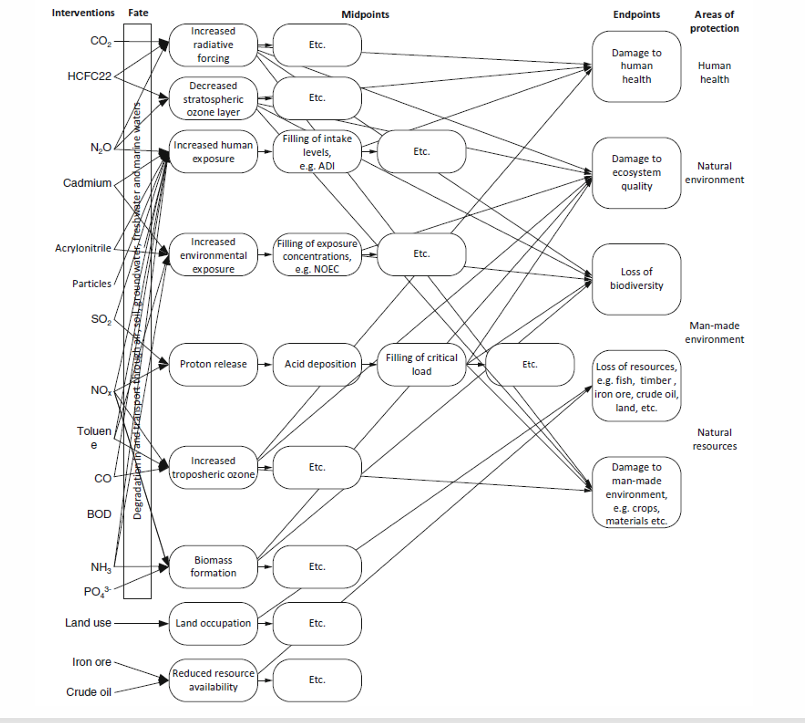
- Life Cycle Impact Assessment:
- Evaluate the environmental impacts of the inputs and outputs identified in the inventory analysis.
- Assess impacts in categories such as climate change, eutrophication, acidification, and resource depletion.
- Interpretation:
- Analyze the results of the impact assessment and draw conclusions.
- Identify potential areas for improvement and make recommendations.
Key Considerations in LCA:
- Scope:
- Product system: The specific product or service being evaluated.
- Functions: The intended purpose of the product or service.
- Functional unit: The unit of measurement used to compare different systems.
- System boundary: The limits of the analysis, determining which processes are included and excluded.
- Cut-off criteria:
- Mass: The minimum mass of a material or substance to be included.
- Energy: The minimum energy consumption to be considered.
- Environmental significance: The minimum level of environmental impact to be assessed.
By conducting a comprehensive LCA, organizations can gain valuable insights into the environmental implications of their products and processes, identify opportunities for improvement, and make more sustainable decisions.
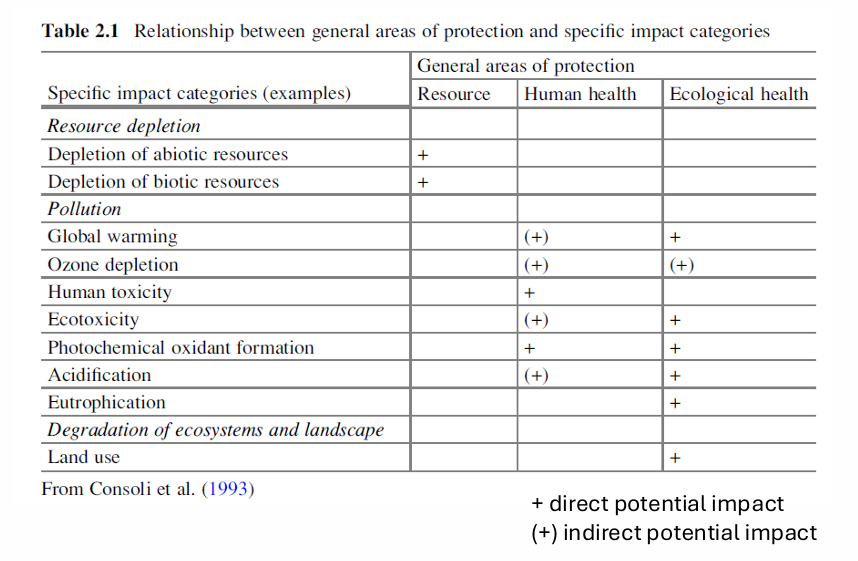
Impact Categories in Life Cycle Assessment (LCA)
Impact categories in LCA are specific environmental effects that can be quantified and assessed to evaluate the overall environmental performance of a product or process. Here’s a breakdown of the commonly used impact categories:
Abiotic Resource Use
- Definition: The depletion of non-renewable natural resources, such as minerals, fossil fuels, and metals.
- Example: Extraction of iron ore for steel production.
Acidification
- Definition: The increase in acidity of soil, water, and air due to the release of acidic substances, primarily sulfur oxides and nitrogen oxides.
- Example: Acid rain caused by emissions from power plants and factories.
Climate Change
- Definition: The long-term alteration of Earth’s climate, primarily caused by the increase in greenhouse gas emissions, such as carbon dioxide, methane, and nitrous oxide.
- Example: Global warming and changes in precipitation patterns.
Ecotoxicity
- Definition: The harmful effects of substances on ecosystems and organisms.
- Example: Pollution of water bodies with toxic chemicals that harm aquatic life.
Eutrophication
- Definition: The excessive enrichment of water bodies with nutrients, leading to algal blooms and oxygen depletion.
- Example: Nutrient runoff from agricultural land causing excessive plant growth in lakes and rivers.
Human Toxicity
- Definition: The harmful effects of substances on human health.
- Example: Exposure to toxic chemicals in consumer products or air pollution.
Land Use
- Definition: The conversion of natural land areas into human-made environments, such as urban areas, agriculture, and infrastructure.
- Example: Deforestation for agricultural purposes.
Particulate Matter Formation
- Definition: The formation of tiny particles suspended in the air, which can come from various sources, including vehicle emissions, industrial processes, and dust.
- Example: Smog caused by particulate matter and other pollutants in urban areas.
Photochemical Ozone Formation
- Definition: The formation of ozone in the lower atmosphere (troposphere) as a result of chemical reactions involving nitrogen oxides and volatile organic compounds.
- Example: Ground-level ozone that can cause respiratory problems.
Stratospheric Ozone Depletion
- Definition: The reduction of ozone in the stratosphere, which protects Earth from harmful ultraviolet radiation.
- Example: The depletion of the ozone layer caused by the release of chlorofluorocarbons (CFCs).
Water Use
- Definition: The consumption of water for various purposes, such as domestic use, agriculture, and industry.
- Example: Water withdrawal from rivers and groundwater for irrigation.
By evaluating the impacts of a product or process on these categories, LCA can help identify potential environmental risks and inform decision-making.


Effect Scores and Weightings for Impact Categories
Effect scores in LCA quantify the environmental impact of a product or process, allowing for comparison across different categories. Weightings are used to condense multiple units into a single unit, making it easier to interpret the results.
Example: Greenhouse Gas Emissions (GHGs)
- Weighting: Global Warming Potential (GWP)
- Units: CO2 equivalents
- Effect score: The total amount of GHG emissions expressed in CO2 equivalents.
GWP values:
- CO2 = 1
- CH4 = 24
- N2O = 310
Calculation:
- If a product emits 10 kg of CO2, 2 kg of CH4, and 0.5 kg of N2O:
- Effect score = (10 kg CO2 * 1) + (2 kg CH4 * 24) + (0.5 kg N2O * 310) = 197 kg CO2 equivalents
Other Impact Categories and Weightings
While GHG emissions are often the primary focus of LCA studies, other impact categories also require weightings to create effect scores. Here are some examples:
- Acidification: Acidification potential (AP)
- Eutrophication: Eutrophication potential (EP)
- Water use: Water scarcity potential (WSP)
- Land use: Land use potential (LUP)
Weighting methods:
- Characterization factors: Convert units of emissions or resource use into equivalent units of environmental impact.
- Damage assessment: Estimate the monetary value of environmental damage.
- Expert judgment: Use expert opinions to assign weights.
Effect score calculation:
- Multiply the quantity of emissions or resource use by the corresponding characterization factor or weighting.
- Sum the results across all impact categories to obtain the total effect score.
Note: The choice of weighting method and the specific values used can vary depending on the study’s objectives, geographical location, and other factors.